The Semantic Map shows the world of topics AI engines connect to your brand — the themes, categories and sub-questions that surround you in AI answers, visualized as an interactive bubble chart.
What you'll see
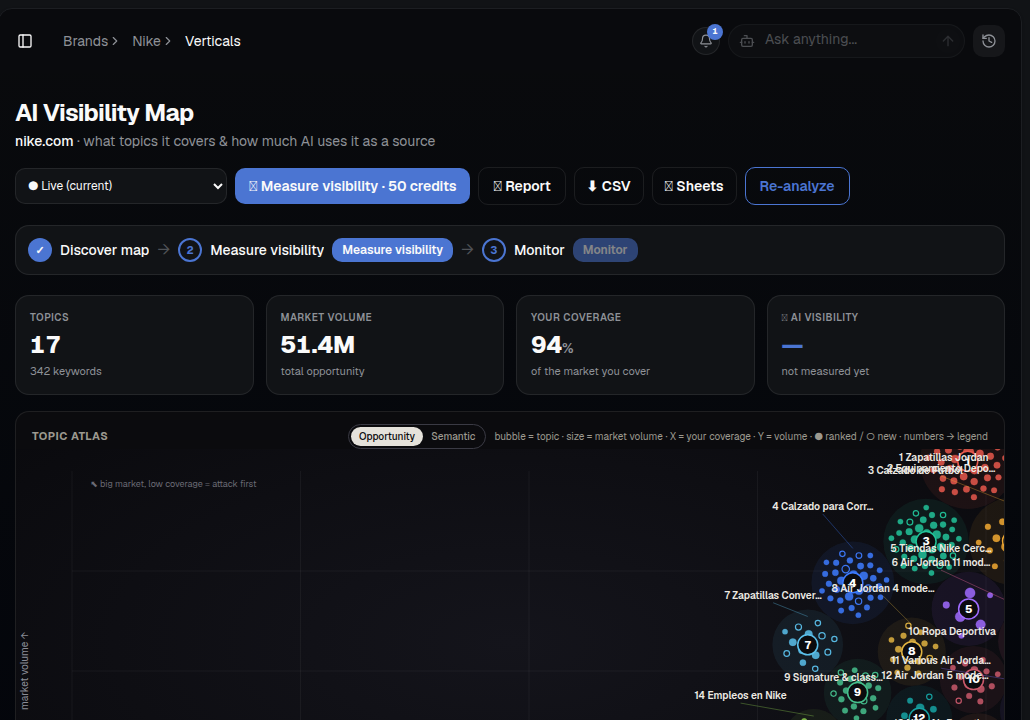
- Topics — the number of distinct topic clusters AI ties to your brand.
- Market volume — the total search/answer opportunity across every topic combined.
- Your coverage — the percentage of that market you currently show up in.
- Topic Atlas — a bubble chart where each bubble is a topic: size = market volume, position = your coverage vs. how often the topic comes up. The "big market, low coverage" corner is where the biggest wins are hiding.
- Opportunity vs. Semantic toggle — switch between "where should I attack first" and "how my topics relate to each other" views.
The three-step workflow
- Discover map — AI Rankia crawls your site and groups what it covers into topics.
- Measure visibility — for each topic, it checks how often AI engines cite you when answering questions in that space.
- Monitor — once you know your gaps, turn the biggest ones into tracked prompts or content briefs.
How to use it
- Open AI Visibility ▸ Semantic Map for the selected brand.
- Look at the Topic Atlas and find bubbles in the "big market, low coverage" zone — these are topics you're relevant to but AI rarely credits you for.
- Click a bubble to see the specific keywords and sub-topics behind it.
- Send the biggest gaps to Content to build coverage, or add them as prompts in Add Prompts to start tracking them.
Tip: Strong topical coverage is what makes AI engines confident enough to recommend you. A brand covering 94% of its market (like the example above) rarely gets skipped when AI answers a question in its space.